
Project summary
I built a lab in Proxmox with Wazuh, pfSense, Nginx/Flask, and a Jumpbox to generate and analyze controlled web traffic.
Three scenarios were tested:
- repeated authentication failures;
- web endpoint reconnaissance;
- requests containing SQL injection-like patterns.
I also created a local Wazuh rule to prioritize the SQL injection signal and validated selective containment with UFW.
Lab architecture
| Component | Role |
|---|---|
| Wazuh | Manager, indexer, and dashboard |
| UbuntuApp | Nginx, Flask application, and Wazuh agent |
| pfSense | Gateway and firewall |
| Jumpbox | Controlled host used to generate test traffic |
The Jumpbox (192.168.20.10) and UbuntuApp (192.168.20.50) were on the same VLAN, so HTTP traffic between them did not need to traverse pfSense.
The Flask application hosted on UbuntuApp generated JSON logs that were later ingested and searched in Wazuh.
Repeated authentication failures
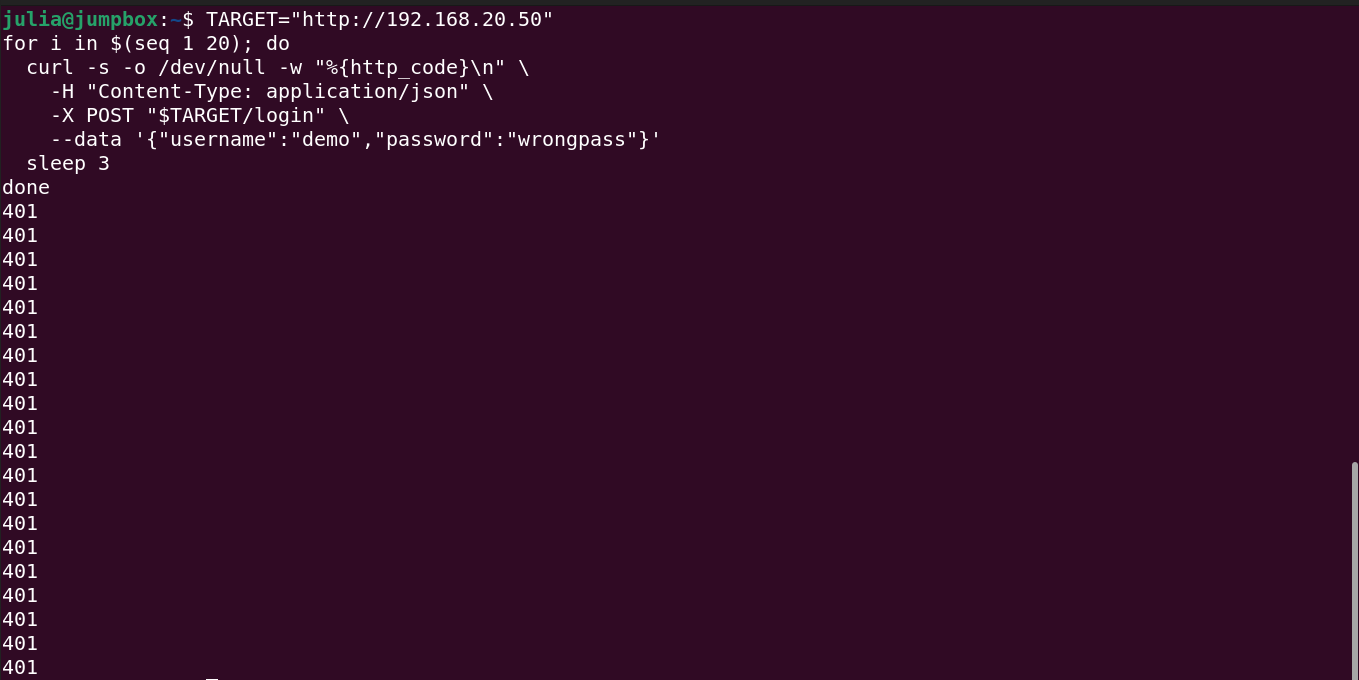
I generated approximately 20 failed login attempts from the Jumpbox (192.168.20.10) against the /login endpoint of the Flask application hosted on UbuntuApp.
In Wazuh, the query returned 20 POST /login events with status 401, all originating from the Jumpbox (192.168.20.10).
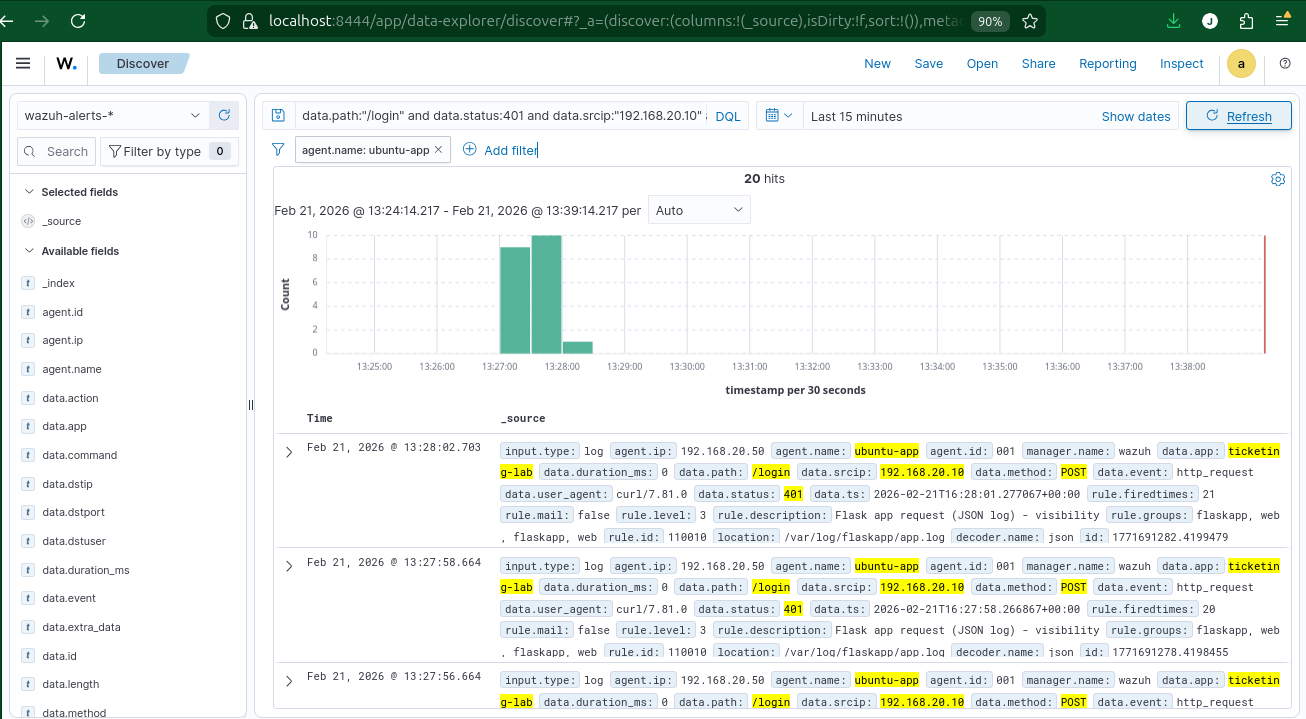
The relevant signal was not an isolated 401 response, but the repetition of failures from the same source within a short time window.
As a detection improvement, this behavior could be handled with a time-based threshold grouped by srcip.
Web resource reconnaissance
From the Jumpbox (192.168.20.10), I also generated requests to different endpoints of the Flask application, simulating a web reconnaissance sequence.

DQL query used:
agent.name:"ubuntu-app"
and data.app:"ticketing-lab"
and data.event:"http_request"
and data.srcip:"192.168.20.10"
and (
  data.path:"/wp-login.php"
  or data.path:"/admin"
  or data.path:"/.git/config"
  or data.path:"/phpmyadmin"
  or data.path:"/.env"
  or data.path:"/server-status"
  or data.path:"/robots.txt"
)
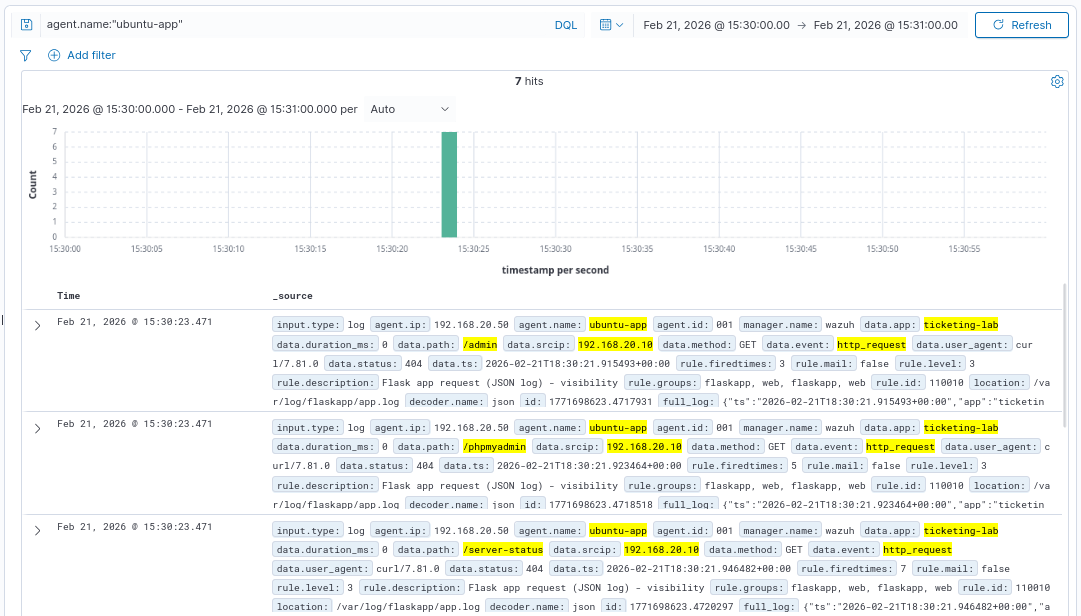
The Wazuh query returned seven events in the analyzed time window, all originating from the Jumpbox (192.168.20.10) and associated with endpoints tested against the Flask application.
Although the responses were 404, the sequence of requests from the same source against different sensitive endpoints made the overall behavior more relevant than each event in isolation.
A more robust detection could consider the number of distinct endpoints, request rate, and sources previously authorized for testing.
Detecting a SQL injection-like pattern
From the Jumpbox, I sent test requests to the /search endpoint of the Flask application containing SQL injection-like patterns such as:
' OR 1=1 --
The goal was to generate telemetry detectable in Wazuh without exploiting the application.
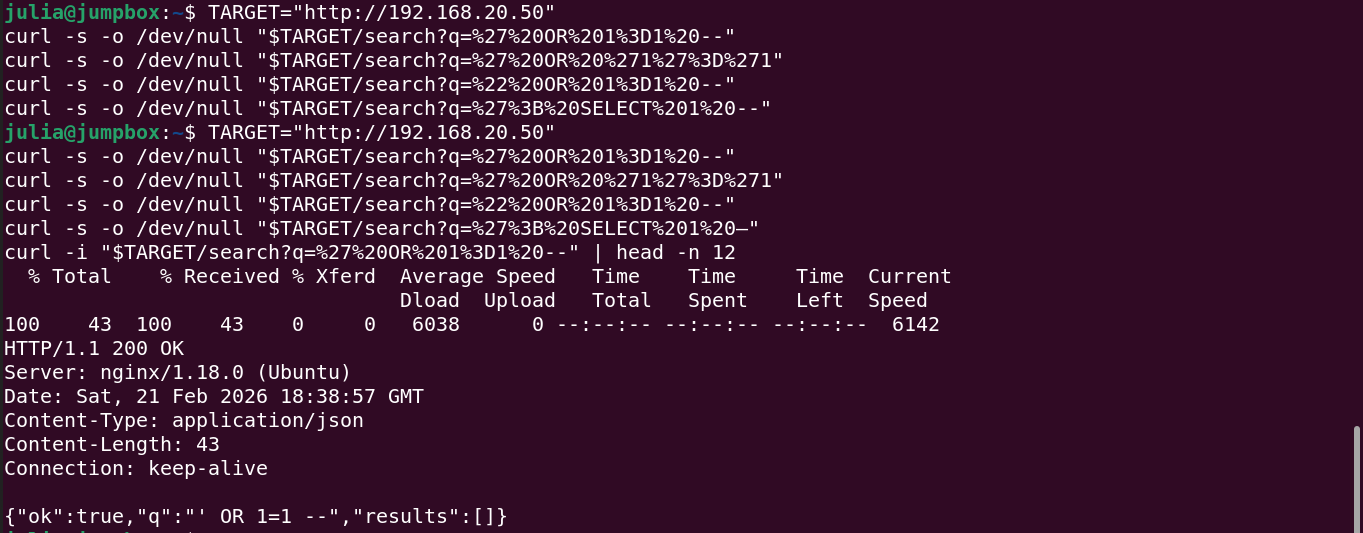
To validate ingestion, I filtered one of the submitted strings in Wazuh.
DQL query
agent.name:"ubuntu-app"
and data.app:"ticketing-lab"
and data.path:"/search"
and data.srcip:"192.168.20.10"
and data.query_string:"q=%27%20OR%201%3D1%20--"
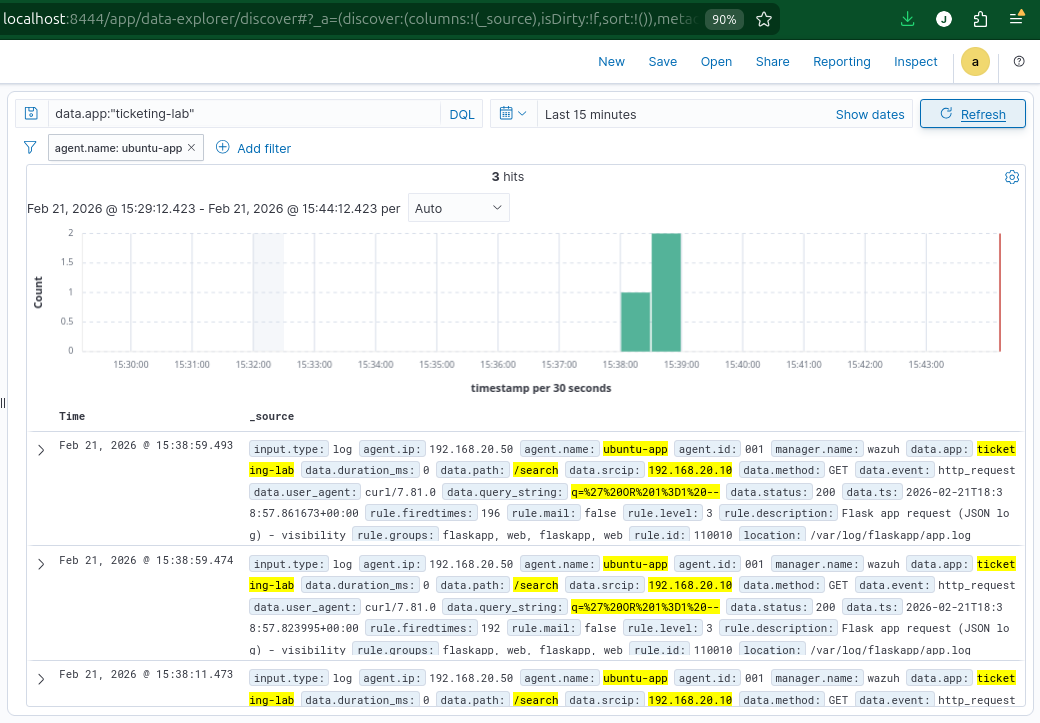
The query returned three events associated with the same query_string value, all originating from the Jumpbox during validation.
The query confirmed that the pattern sent from the Jumpbox was recorded in the application telemetry and could be identified in Wazuh, providing the evidence needed for the next alert-prioritization step.
Custom prioritization rule
Wazuh includes a built-in rule for web patterns associated with SQL injection:
rule.id: 31164
level: 6
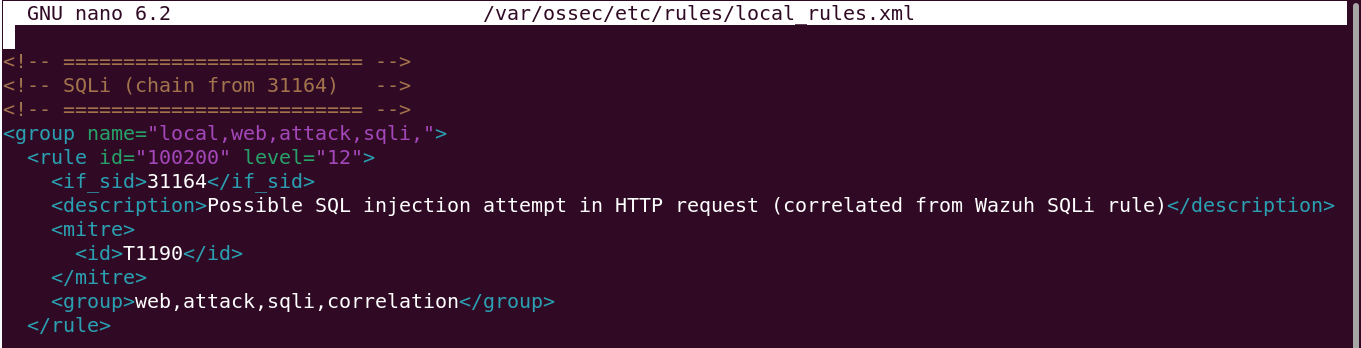
To make the signal more visible during the lab, I created a local rule that generates a new alert when the built-in rule fires:
Local rule: 100200
Level: 12
Source rule: 31164
MITRE ATT&CK: T1190 — Exploit Public-Facing Application
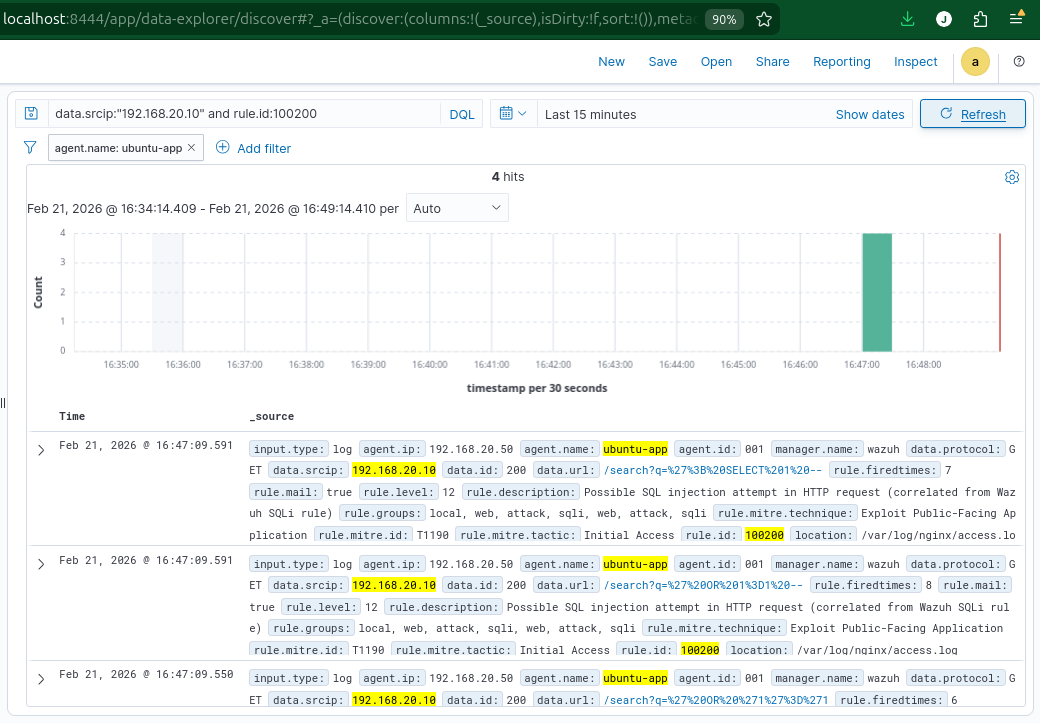
Rule 100200 generated level 12 alerts, making the signal easier to prioritize in Wazuh.
Implementation limitation
The local rule shown in this lab generated a new alert for every occurrence of rule 31164.
A more robust version could apply time-based correlation by data.srcip and consider frequency, expected application behavior, and source context.
Analysis support resources
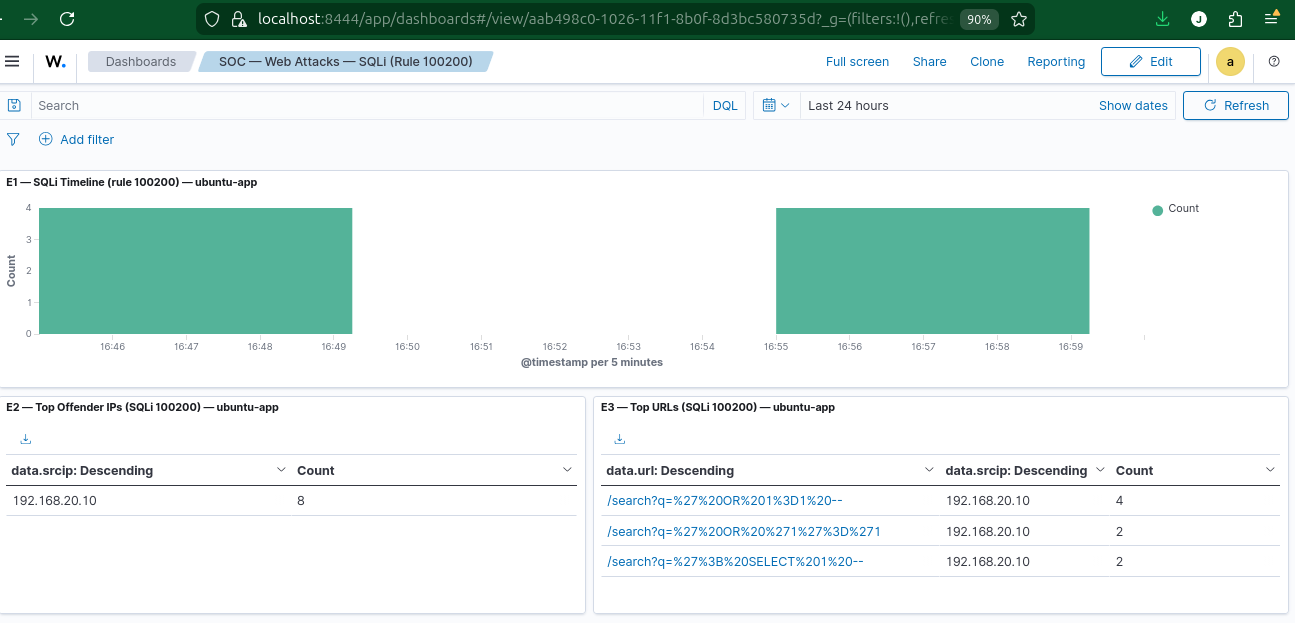
I created a Wazuh dashboard to visualize alert sources, timestamps, and associated URLs.
I also developed a Python script to summarize IP addresses, endpoints, status codes, and query strings.
Example usage:
python3 summarize_flask_logs.py /var/log/flaskapp/app.log
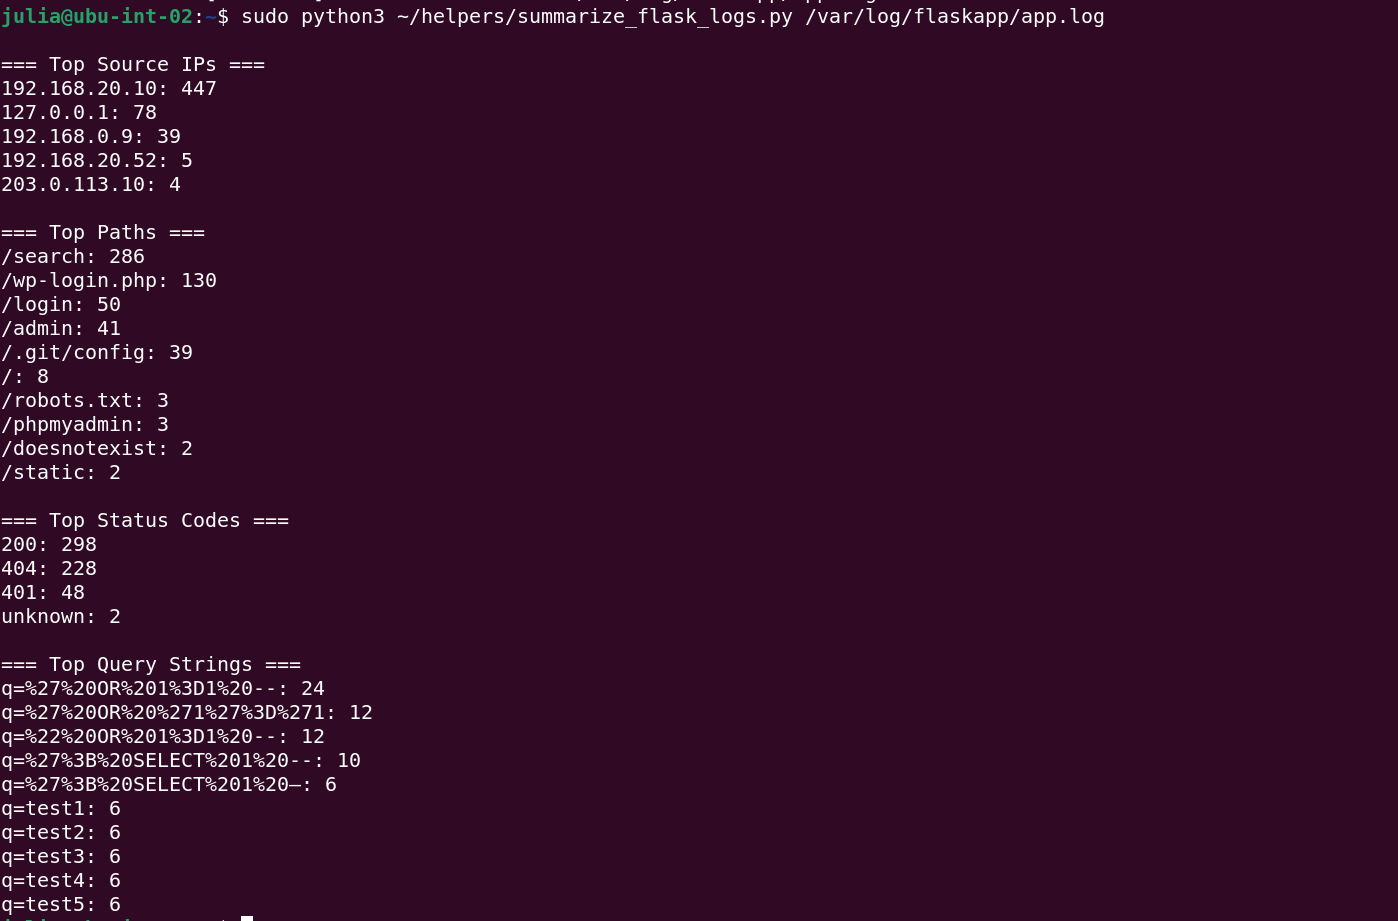
The script organizes application logs by:
- top source IP addresses;
- most frequently accessed endpoints;
- HTTP status codes;
- observed query strings.
These resources help structure the initial analysis, but conclusions still depend on reviewing Wazuh events and the Flask application logs.
Containment and validation
Because the Jumpbox (192.168.20.10) and UbuntuApp (192.168.20.50) were on the same VLAN, I applied containment directly on UbuntuApp using UFW.
The rule blocked TCP/80 connections originating from the Jumpbox (192.168.20.10) toward the web application on UbuntuApp, while keeping SSH access available for management.

I then validated connectivity from the Jumpbox.
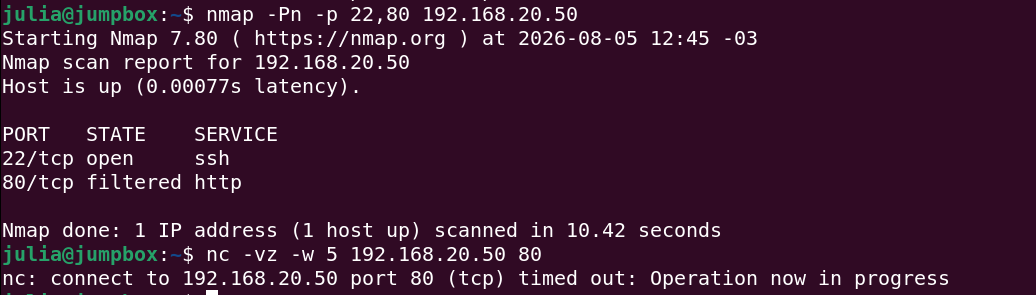
Nmap showed 22/tcp open for SSH and 80/tcp as filtered. The Netcat test also timed out on port 80.
The results confirmed that HTTP connections originating from the Jumpbox were blocked without removing management access.
Conclusion
The lab integrated structured Flask application logs, Wazuh detection, alert prioritization, analysis support with a dashboard and Python, and selective endpoint containment.
Validation showed that the UFW rule filtered TCP/80 for the test source while preserving SSH access.
As future improvements, the detection rules could incorporate time-based correlation and additional source context to reduce noise and make prioritization more precise.